
This week, I’ll describe how one can easily use the Jan 15th explosive volcanic eruption in Tonga to obtain strong evidence that the Earth’s a sphere and determine its circumference, using nothing more than simple arithmetic. This illustration of scientific measurement is perfect for any science classroom, because it uses publicly accessible data, is straightforward enough for a 12-year-old to follow, and is meaningful to every human being. Moreover, students can be set free to find their own data sets online, and yet all will get the same answer in the end. It is my hope that science teachers worldwide will begin to include this exercise in their classrooms.
In this first post, I’ll explain how to verify that the Earth’s approximately a sphere. It’s not quite a proof yet, because there are loopholes to close; but before the end of the week the evidence will be conclusive.
Background
Fortunately, volcanic eruptions as powerfully explosive as Tambora (1815), or even Krakatoa (1883), are seen only a few times a millennium. When they do occur, loss of life and destruction of homes and livelihoods can be immense. The full human cost of the tremendous blast ten days ago, at a mostly underwater volcano in the Kingdom of Tonga, is still not fully known; some islands in the archipelago were completely swamped by large tsunami waves, and the toll in lives and houses is not yet clear. Meanwhile, many aspects of the explosion itself are still puzzling scientists. But these are not the stories for today.
The explosion created a (literally) deafening blast of sound, and a wave of pressure so powerful that it could easily be detected by weather stations around the globe, both those of professionals and those in the homes of ordinary people. In fact, many stations detected the wave passage multiple times. Not since the era of thermonuclear weapons tests, prior to the 1963 nuclear test ban treaty, have we (to my knowledge) observed such a crisply defined pressure wave from an explosion of this magnitude. (The explosion, probably a combination of water flashing to steam upon contacting rising magma, along with the release of gas dissolved in that magma, has been estimated as equivalent to at least 10 megatons of TNT, nearly a thousand times larger than the atomic bombs of World War II and comparable to the largest thermonuclear weapons ever tested.) Back in the ’60s, ordinary people had no easy access to precise data from weather stations, and there were fewer stations around the world, too. Because of today’s technology, this explosion, more than any prior, offers us a unique educational opportunity, a silver lining to this disaster that science teachers across the world should take advantage of.
The Method of Great Circles
How can you tell if the surface you live on is a sphere? Easy, if it’s small enough, like the planet of the Little Prince. You start from your home, and start walking in any direction you choose. Just keep walking straight ahead; you will eventually come home again. Let’s say it took you one hour. Well, now that you’re home, pick another direction, and start walking straight ahead at the same steady pace until you again return home. This second trip should also take you one hour. Repeat as desired; every round trip, in every direction, should cover the same distance, and assuming your walking speed is always the same, it will take the same amount of time.
Each of these trips would be on a path called a “great circle”, which is a circle that divides a sphere into two equal halves; these are the longest circles that you can draw on a sphere, and they each have the same length — the circumference of the sphere. Here’s a drawing with three of them. Famous great circles on the Earth are the equator and all lines of longitude (but not lines of non-zero latitude, which don’t divide the world into equal halves.)
Of course, walking around the Earth would be impractical; not only would it take too long, the oceans would get in your way. You could consider taking an airplane on a series of trips, starting from your home airport and traveling straight ahead until you came back home — but expense, politics and weather would interfere, and the technology for a non-stop round-trip tour isn’t in place.
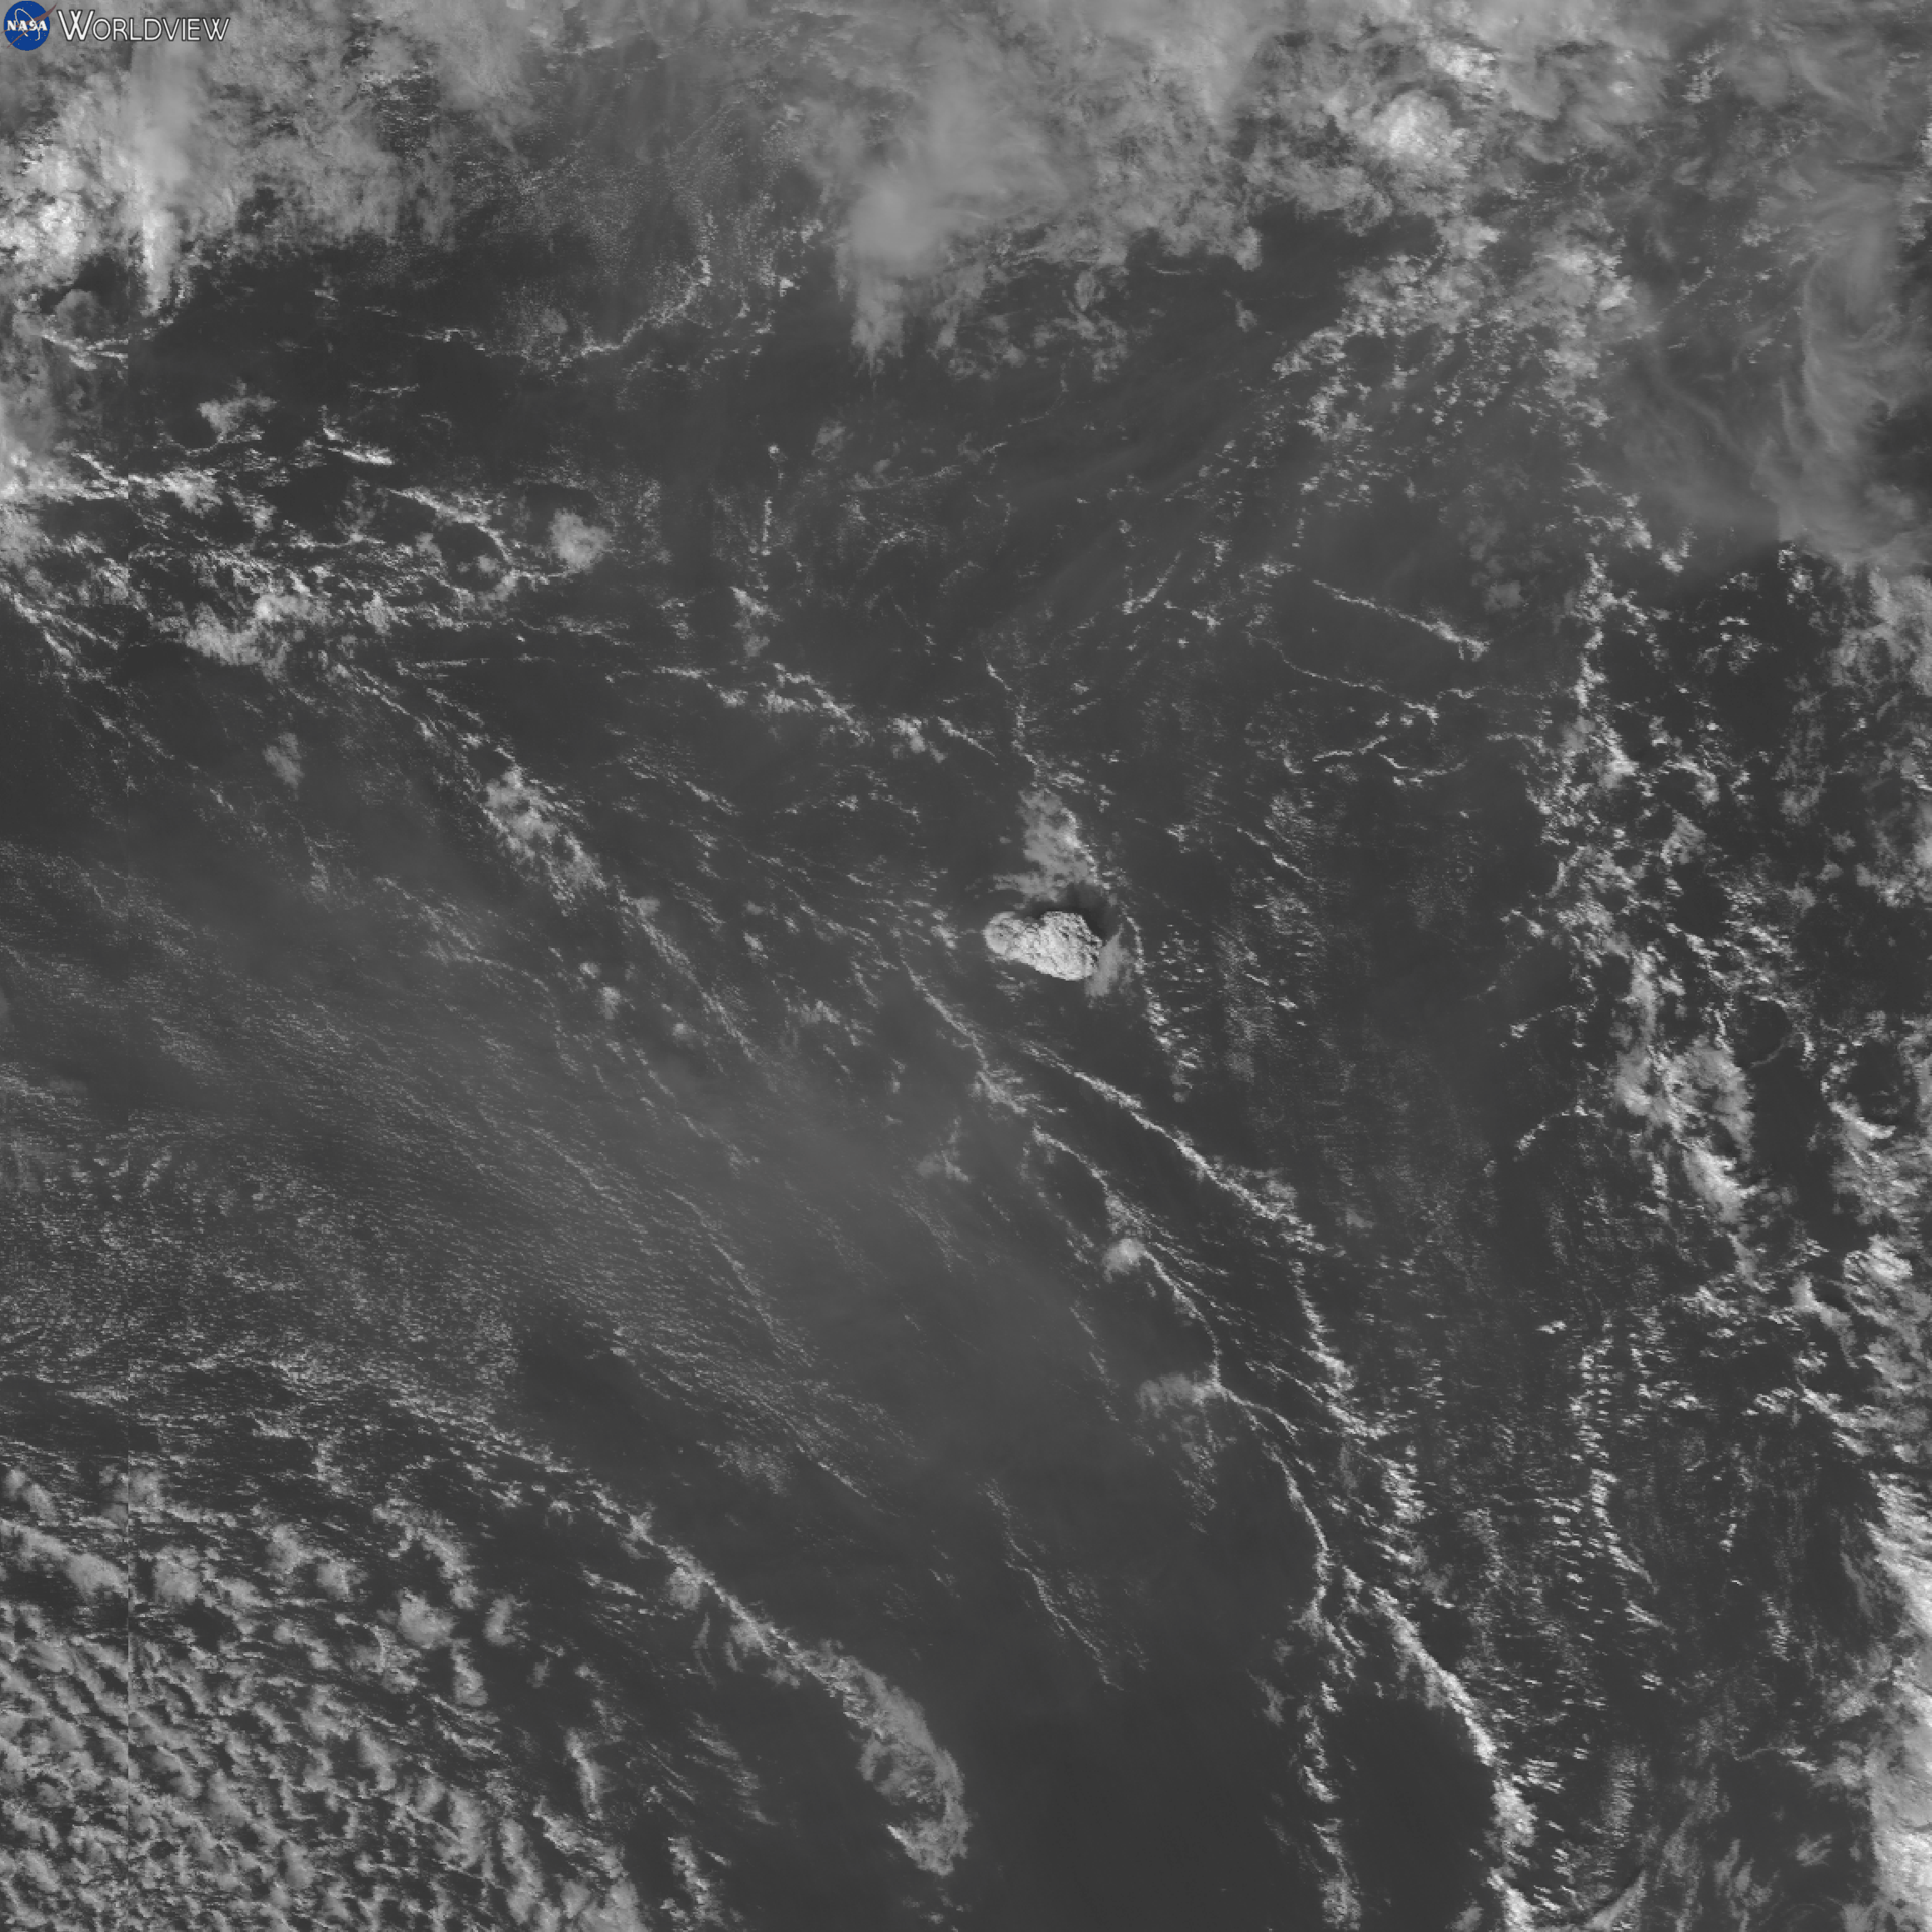
What’s so useful about a blast wave, for this purpose, is that the wave takes all these great circle trips around the world, in all directions, simultaneously, at no cost to you — not to mention that it’s apolitical. The wave spreads out in all directions, forming an expanding circle; that this was true for the Tonga explosion can be confirmed from pressure measurements, but can also be seen in the satellite images below, of water vapor around the Earth in the hours following the explosion.
Such a wave will continue to spread until its size is as large as the Earth’s circumference; then it shrinks down until it converges at a point exactly on the opposite side of the Earth from the volcano. It then passes through itself and retraces its steps, beginning to grow again. Here’s a visualization, showing an entire round-trip, by @StefFun. Note that one round trip has four stages: expanding from the volcano, shrinking down to the opposite point, expanding again from that point, and shrinking down back the volcano’s location. We can call the first half the “outbound” portion, and the second half the “returning” or “inbound” portion. This pattern repeats over and over until the wave has lost too much energy to be detectable any longer.
It might appear, from these animations, that the wave is going halfway round the Earth and then bouncing back. But in fact, the wave is passing through itself! What’s happening in this round trip is that each little part of the pressure wave is making its own great-circle loop of the Earth. All those great-circle trips happen simultaneously, giving the pattern seen above. And like a sedentary Little Prince, you can use that pattern to see if the Earth’s a sphere.
That’s the Theory. Is it True?
Everything that I’ve just described will be true under two assumptions:
- The Earth really is almost spherical.
- The shock wave really does travel at an almost constant speed in all directions.
These two assumptions can be tested, and if they are (approximately) true, they can be used to measure (approximately) the size of the Earth. [Note: We’re actually also assuming the atmosphere is thin compared to the size of the Earth, so that the wave’s energy stays trapped in a relatively thin region above the ground.]
Here’s the logic. If the Earth’s a sphere and the pressure wave’s a circle moving at constant speed v, then
- each little section of the pressure wave travels around the Earth in a “great circle”, whose length is the circumference of the sphere C.
- the “round-trip time”, which we’ll call “T”, is the same for every part of the pressure wave, as illustrated in the tweet above, with T = C / v .
From this behavior of the pressure wave, we obtain a prediction: no matter where you are located on the Earth relative to Tonga, the wave as it passes over you is on a round-the-Earth trip that will take a round-trip time T. During that trip one bit of wave will pass you once during its outbound portion, and the opposite bit of wave, going the other direction, will pass you during its inbound portion; so you will see the wave twice each round trip. Because all parts of the wave are moving at the same speed (by assumption) and all are traveling the same distance (by assumption), you should get the same value of T no matter where you live. If you can measure T, and you have fourteen friends in fourteen other countries who can also measure T in an analogous way, the fifteen of you should all get the same answer.
But how can we measure T, the round-trip time, while sitting at home?
Measuring the Round-Trip Time T
The volcano exploded at about 415 UTC on January 15th. (UTC is a 24 hour universal time which is used world-wide to avoid getting confused by time zones, but it corresponds to a time zone used by several nations in far western Europe and in west Africa.) Its pressure wave was strong enough to create sudden spikes and/or drops in the pressure each time the wave passed by (but let me just refer to this Fdisturbance as a “spike” for brevity.) These could be measured by barometers on the ground. In many places, the wave was strong enough, the atmosphere calm enough, and the barometers precise enough that several spikes were seen.
Here’s an example from the Met Office in the United Kingdom, and one (with average pressure removed to make the spikes easier to see) from Iceland.


Let’s imagine you yourself have a barometer which shows as many as four spikes. Let’s call T1 the time between the volcano’s explosion and the appearance of first spike. (I used different notation in my last and more detailed post: T1=t1-ts .) We’ll similarly define T2, T3, T4 for the second, third and fourth spike. Then from these four time measurements, there are three independent methods you can use to measure T, and they should all give the same answer.
The key thing to remember, before interpreting these disturbances, is that the pressure wave passes you twice on each of its round trips, and so you see the pressure spike twice per round trip. (Remember each round trip involves four stages, two of them the expansion and contraction of the outbound portion, and two of them the expansion and contraction of the inbound portion. You may want to look at the tweet above if you need a reminder.)
What that means is that spike 1 is caused by the shockwave when it is outbound on its first round trip, and spike 3 is caused when it is outbound on its second round trip, so they are separated by the round-trip time. In other words
- T3 – T1 = T
Similarly, spikes 2 and 4 are caused by the shockwave when it is inbound on its first and second round trips, so they too are separated by the round-trip time.
- T4 – T2 = T
Now the last way to measure T is slightly more subtle, although the answer’s very simple. It turns that
- T1 + T2 = T
Why is this true? It is visualized in the Figure below The key is that the speed v (which we don’t know yet) is constant. The bit of the wave that headed from the volcano towards you took a time T1 to reach you, during which the wave covered a distance D1 = T1 v. (Remember T1 is the time that elapsed from the volcanic explosion until your observations of the first spike.) But the second spike was caused by the bit of wave that started in the opposite direction, heading away from you; it reached you after going the long way around the Earth. This required a time T2, and during that time the wave covered a distance D2 = T2 v. But as you can see from the figure, D1 + D2 is the entire circumference C of the Earth! So if T1 is the time it takes to travel a distance D1 , and T2 is the time it takes to travel a distance D2, then their sum must be the time it takes to travel the distance C — and that, by definition, is the round trip time T.

So if you see four spikes, you get three ways to measure T that should all agree, as long as the shockwave moves at a constant speed and the line from the volcano to you forms a part of a great circle. If you see three spikes you get two measurements, but even with just two spikes — no simple repeats — you still get one measurement of T.
But if the Earth’s a sphere and the wave’s speed is constant, then everyone around the world should agree on the measurement of T, even though each of us will measure a different T1, T2, T3, T4 depending on where we live. If all our measurements of T are the same, then the assumptions we started with — that the eruption caused a circular shock wave of constant speed that moved around a spherical Earth — are consistent with the data. If they are slightly off, then our assumptions are only approximately true, but close enough to give us roughly the right idea.
Let’s grab some data from around the world and see what we get.
Data and Measurement
I obtained data from a variety of places, and did my own estimates of the spike arrival times (which can be done to within an accuracy of 30 to 90 minutes, typically). I then converted those to the time elapsed since the volcanic explosion, being careful to account for time zones and convert to UTC. In some cases I could only determine T1 and T2, but sometimes I could get T3 or even T4 . Then, I computed as many estimates of the round-trip time T that I could obtain with the two, three or four spikes from each location. All this information is given in the table below. You are encouraged to find other sources of data and try this yourself.
| Location | T1 | T2 | T3 | T4 | T1 + T2 | T3 – T1 | T4 – T2 |
| Iceland | 1315 | 2300 | 4915 | 5900 | 35hr 15min | 36hr 00min | 36hr 00min |
| Beijing | 0910 | 2635 | 4520 | 35hr 45min | 36hr 10min | ||
| Netherlands | 1500 | 2130 | 5015 | 5615 | 36hr 30min | 35hr 15min | 34hr 45min |
| Hawaii, USA | 0445 | 3115 | 3945 | 6745 | 36hr 00min | 35hr 00min | 36hr 30min |
| New Jersey, USA | 1115 | 2435 | 35hr 40min | ||||
| Switzerland | 1545 | 2100 | 36hr 45min | ||||
| Seattle, USA | 0830 | 2745 | 4415 | 6345 | 36hr 15min | 35hr 45min | 36hr 00min |
| Southern Chile | 0845 | 2805 | 36hr 50min | ||||
| Miami | 1015 | 2530 | 4515 | 35hr 45min | 35hr 00min |
Remarkably, from these places that lie in wildly different directions and distances from Tonga, all of the values of T that I obtained fall between 34 3/4 hours and 36 3/4 hours, a variation of less than 10%. (I couldn’t find data from Australia, New Zealand or Southern Africa that showed multiple spikes; do you know of any?) My time measurements were often ambiguous at the 5% level, because the pressure wave often consisted of multiple spikes and dips, so just from my measurement uncertainty one would expect to see several percent variation in these values of T.
The close agreement among the values of T then implies that both of our starting assumptions — that the Earth is spherical and that the pressure wave traveled with a constant speed — are consistent with data, to better than 10%.
About the assumptions: Of course I know, from other data, that the Earth is spherical to within 2% — it is slightly squashed, so that a great circle of longitude is 2% shorter than the length of the equator. So I knew beforehand that the first assumption would be okay to 2%. But given that the speed of waves can vary with temperature and perhaps other atmospheric effects, it wasn’t obvious that the second assumption would work out. Since the numbers all agree, apparently it was more or less correct too.
Is The Earth a Sphere? Mmm… We’re Not Quite Done
So there you have it. Within less than 10%, our assumptions of a roughly spherical Earth and a roughly circular pressure wave of roughly constant speed are consistent with data.
Is this a complete proof of a near-spherical Earth? Nope. We’re close, but there are still loopholes. For example, suppose the Earth looked like an ellipsoid, with the volcano placed exactly at one end. We’d all still find equal values of T. Can you see why?

There’s even a flat-earth hypothesis that we haven’t quite excluded yet! Can you identify which one? (It would easily be ruled out for other reasons, but not from this data alone.)
In the next two posts I’ll show you how to identify the origin of the loophole, and then close it for good. And after that, we’ll measure the circumference of the Earth.
(to be continued)


One Response
Great post, a wonderful idea to talk about at school.