In various contexts, one may have to compute the total energy of empty space, which is a sum of various contributions. There’s nothing special or weird in this sum: if there are four contributions, E1, E2, E3, E4, then the total energy is just
- Etotal = E1 + E2 + E3 + E4
But suppose the energy depends on something, let’s say the average value v of the Higgs field. Well, then, we convey this dependence by writing E1(v), etc. And again, there’s nothing special in the sum that we have to do; for any particular value (v) of the Higgs field, the sum is as before:
- Etotal(v) = E1(v) + E2(v) + E3(v) + E4(v)
But suppose we want to represent this graphically?! Let’s learn how to do that…
We can do any sum of three or more things by adding the first two together, then adding the third, then the fourth… so it’s enough to just learn how to do two of them. In the Figure below, two curves, one in blue and one in red, are graphs of two contributions to the energy density, E1(v) and E2(v). What does the curve corresponding to E1(v) + E2(v) look like? Well, of course you can use a computer to get the answer; it takes a microsecond. But you can do it qualitatively, without a computer, to get more intuition for how it works.
Start with the blue curve. Pick any point along the horizontal axis, this corresponds to a particular value of v. Draw a vertical blue arrow from the horizontal axis until it intersects the curve — I’ve done this for several values of v. If the arrow points up, its length is E1(v); if it points down, its length is -E1(v). Now do the same for the red curve; the length of an upward-pointing arrow is telling you E2(v). To find the sum,
- take the blue arrow from a location on the horizontal axis at the location v ;
- place it in the same place, on a new graph;
- take the red arrow that comes from the same location along the horizontal axis, and attach its beginning to the end of the blue arrow;
- finally, draw a green dot at the end of the red arrow
If you do this for every location along the horizontal axis — for every value of v — then you’ll get the green curve.
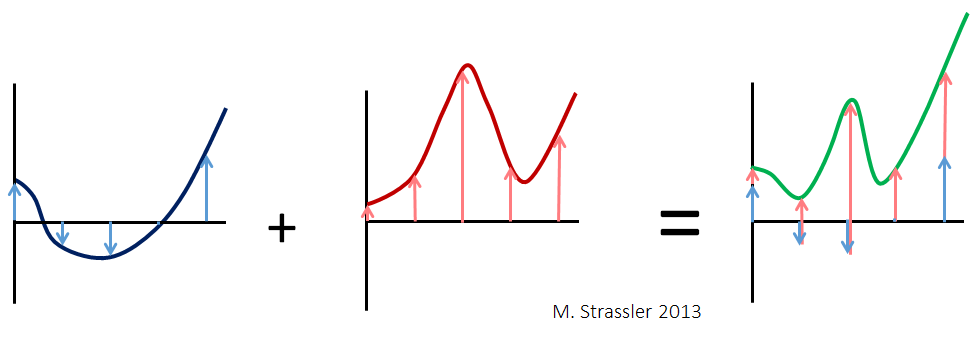
One important thing that you notice when you do this is that although the wiggles in the green curve don’t look in detail like the wiggles in the red and blue curves, they are of roughly similar height and depth, and the distance from one wiggle to the next hasn’t dramatically changed. The lesson is that you’re not typically going to get a striking curve if you add two rather boring curves together. And that’s important to know!

One Response
What? No yellow Wiggle?
But seriously, your articles are excellent, even I can understand them.