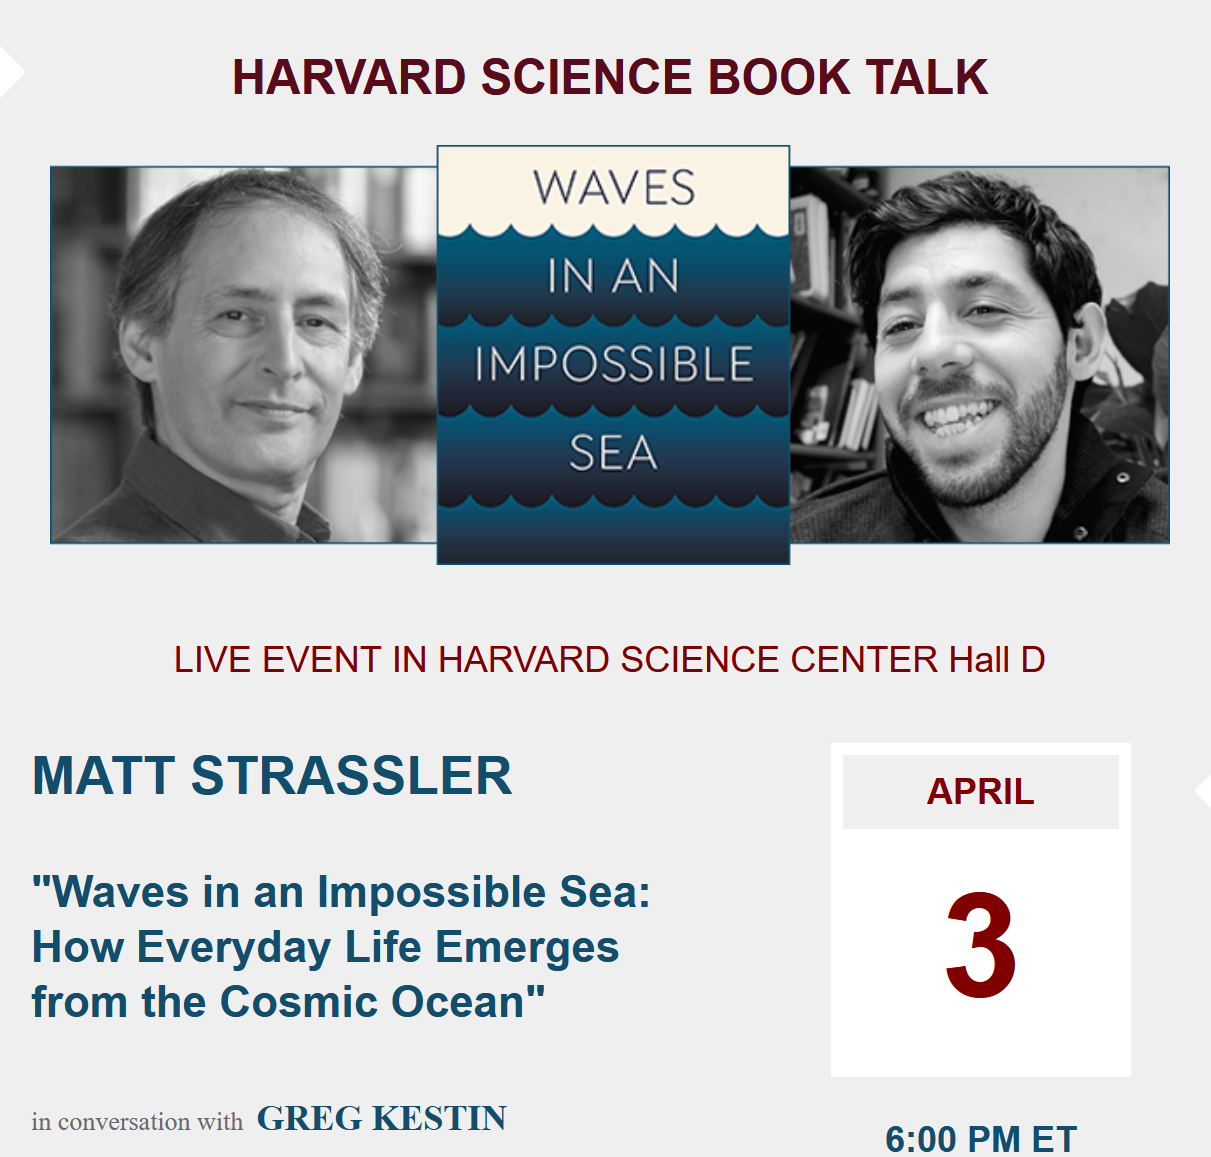
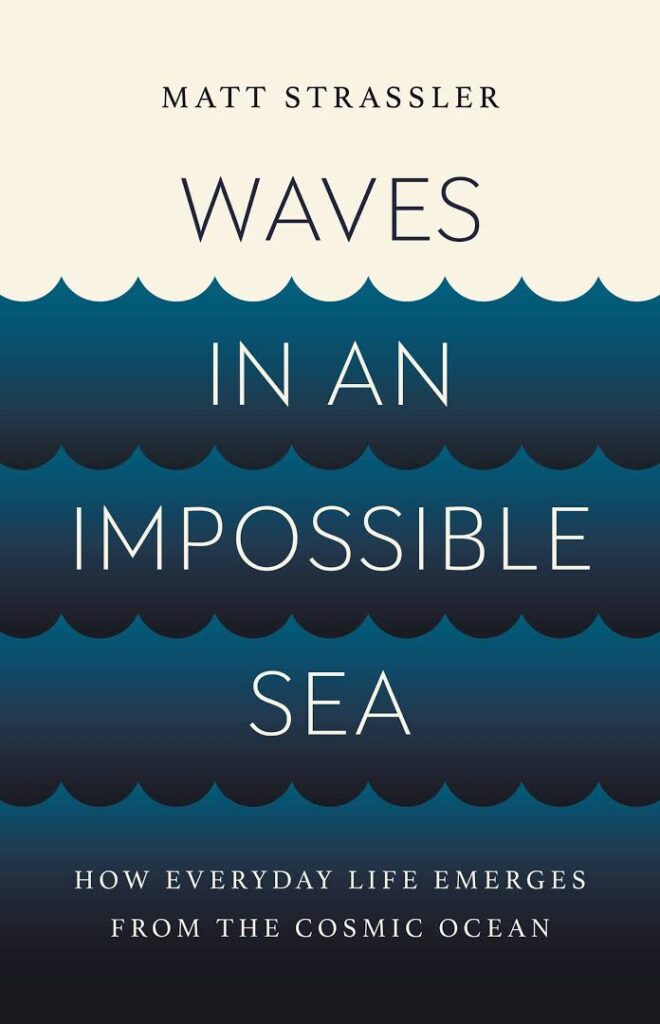
Fig. 1: Of the 20 plots shown in yesterday’s post, the five marked in red have no Higgs signal, and contain nothing but statistical fluctuations on a background that, with infinite statistics, would give a flat horizontal histogram.
Well, I hope some of you attempted yesterday’s exercise, which involved looking at a bunch of plots with simulated data, and trying to figure out in each plot
- is there a signal of the “Higgs particle” in the plot?
- what roughly is the mass of the “Higgs particle” (which I assured you lies, for each plot, in the range 122-127 GeV/c²?)
So now let’s see how well you did, and also what the implications are for the 3 GeV/c² discrepancy between the two measurements by the ATLAS experiment of the Higgs particle’s mass — a discrepancy which led to a big discussion (which ATLAS did not encourage or generate, mind you). Some speculated (and others chose to report this speculation in the news media) that there might be evidence in this data for two Higgs particles. (This is contradicted by CMS’s result from November, but hey, who’s counting?) But the substantive question you might ask is: Is this such a big discrepancy that either there are two Higgs particles or ATLAS has made a big mistake?
With that in the back of our minds, let’s take a look at the exercise I proposed yesterday, and see how things go. Note, however, that this exercise does not have direct or precise implications for ATLAS’s discrepancy. First, these plots are made in crude fashion and without simulating real Higgs particles, though the signal and the background are about the right size to match ATLAS’s current data on a Higgs decaying to two lepton/anti-lepton pairs. Second, ATLAS uses very sophisticated methods to measure the Higgs mass, much more powerful than you could employ by eye, and much more than these graphs could convey. Rather, the point here is to convey limitations of human psychology, and illustrate that humans are not naturally skilled at evaluating the statistical properties of small amounts of data.
Which Plots Have a Higgs Signal and Which Do Not?
15 of the 20 plots shown yesterday (in a larger figure that will be easier for you to read) have a Higgs signal; the others, marked with a red line in Figure 1, do not. That probably wasn’t too hard, except for the uppermost plot in the right column, because the plots without a Higgs have close to 40 events while those with a Higgs have close to 60; and the discrepancy is especially big in the range 120-130 GeV/c2 where I told you that the Higgs is to be found. Some people would have been tripped up by the peak in the bottom left plot, were it not for the fact that I told you the Higgs particle couldn’t be there.
Now on to the next question: What, roughly, is the Higgs mass in each of the 15 plots that have a signal.
Estimate the Higgs’ Mass
This is generally what trips people up the most. The human brain is an absolutely terrible statistician. It takes years of practice to unlearn what your brain wants to tell you — graduate students, and even senior theoretical physicists who haven’t stared at enough data, do an awful job with a problem like this.
For example, take Figure 2, which is one of the plots I showed yesterday. [Recall that the bins are 1 GeV/c² wide, and the bin just to the right of the 2 in "125" is the bin running from 125 to 126 GeV/c².] Your eye wants to tell you there’s a big peak at 126-127 GeV/c² and so that’s where the Higgs mass should be. But you’ve been warned that the Higgs peak is 4 GeV/c² wide at half its maximum height — so it shouldn’t just be a one-bin wide spike! Still, your brain forgets this and your eye misleads you. If you look carefully, there are rather few events to the right of the highest bin, and more to the left. The real Higgs mass is quite a bit lower than 126-127 in this case.

Fig. 2: One of the 15 plots with a Higgs signal.
Now what about Figure 3? This looks like it has a double peak! It has one peak between 123 and 124, and another between 126 and 127! But I assure you this was generated by a signal that has a single peak. Your eye, yet again, is fooled. The real Higgs mass in this case lies between the two peaks.

Fig. 3: Another of the 15 plots with a Higgs signal.
And Figure 4? This case doesn’t look too hard; there are several events in the 125-126 bin and several in the 126-127 bin, just 2 in the 127-128 bin, and none in the 124-125 bin. So clearly the Higgs mass should be between 125 and 127, probably 126. But in fact the actual Higgs mass in this case lies in the empty bin!

Fig. 4: A third plot with a Higgs signal.
The Truth is Revealed
Well, as the experts who are looking closely will already have guessed, every single one of these 15 plots was generated with a Higgs mass of 124.7 GeV/c2. Every one.
If there were 400 times as many events as in each of the plots from yesterday, here’s what you would see; three of the plots in Figure 5 show what the data looks like with a Higgs peak, and the fourth shows what the random background looks like.

Fig. 5: All the plots that contained a Higgs signal had a Higgs at 124.7 GeV/c2, whose shape (with 400 times the amount of data) is shown in three of the above figures, above a flat background. The background alone is shown in the upper right plot.
I assure you there was no funny business in generating the plots from yesterday. No bias was introduced. Try it yourself if you don’t believe me! The computer program was designed to sample this flat background plus smooth peak at random. When you pick only 20 or so events from such a peak, and another 40 or so from the flat background, you’ll get something that looks quite squiggly. The peak in the resulting plot can easily lie one or even two GeV/c2 away from the true mass, as in Figure 2; there can appear to be two peaks, as in Figure 3; the bin with the true mass can actually be empty, as in Figure 4. And the probability of the plot looking weird in some way, given this small amount of data, should not be underestimated — it’s maybe one in four or five.
The Implications
What’s the point? The photon-based and lepton-based measurements of the Higgs mass at ATLAS differ by 3 GeV/c2, which is bigger than we’ve seen here. So what? The photon-based mass measurement is 126.6±0.3±0.7 — the first uncertainty number is due to random statistics, the second is called “systematic” and includes experimental defects and other problems. So it has a systematic uncertainty of nearly a GeV/c2 (which is always ignored by the press, as though uncertainties don’t matter in interpreting what you actually know). Systematic uncertainties are often not random; they may give an overall shift to all the data, moving the peak uniformly up or down. And the lepton-based measurement is 123.5±0.9+0.4-0.2 GeV/c², which has an upward systematic uncertainty of almost half a GeV/c2. So if ATLAS got unlucky and their lepton-based result got pulled down by a couple of GeV/c2 purely due to the statistical effects we’ve seen today, and if they have small systematic problems of nearly a GeV/c2 in one or both of their measurements, they could potentially get a 3 GeV/c2 discrepancy.
Is such a big discrepancy likely? No; it is certainly possible, but it is certainly not very likely.
But here you have to remember how statistics works. If instead of asking “is this particular weird phenomenon likely” you had instead asked “is it likely that somewhere, in all of the measurements that ATLAS is making about the Higgs, one or two of them would have turned out weird”, the answer is “very likely indeed!” I’m writing and you’re reading a post about the mass measurement — and so are other bloggers and Scientific American and all the rest — because currently this is the one that looks odd. It could instead have been that there was a double peak in the photon-based plot, or that the lepton-based plot was showing no peak at all (simply because the signal rate fluctuated down from 20 events to 11, which is just 2 standard deviations.) Or the measurements of the spin and parity of the Higgs could be looking strange. In that case we’d be talking about those things instead. In July people were talking about the hint that the Higgs didn’t seem to be decaying to tau leptons; well that’s over and done.
In other words, there’s a tremendous bias both among scientists and the news media. We always talk about the outliers, the things that look odd to us. We make a big deal about them, and of course, to some extent we should. But we often forget that although these outliers look unlikely,
- they aren’t generally as unlikely as they look to our brains, and
- the probability of something being an outlier, when many things are being measured, is not small.
I personally think it would be enormously helpful if scientists would remind the news media of this well-known fact, and if the news media would convey it to the public. It would help the public understand how science is really done — and explain why it is so very common that the big story that you read about on the science pages simply disappears, after its 15 minutes of fame, without leaving a trace.
The most interesting outlier is ATLAS’s hint that the Higgs decays more often than expected to two photons; on this everyone (including the Scientific American journalist) agrees. We had that hint last December, in July, and still now. However, although CMS saw something somewhat similar in July, they’ve (somewhat disturbingly) delayed making their most recent data public on this measurement. So right now there’s still no way to know if this is more than a fluke, because the ATLAS result by itself is still not statistically significant.